Earned Value Management
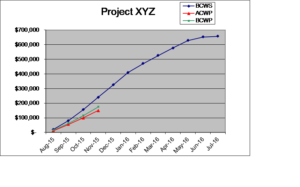
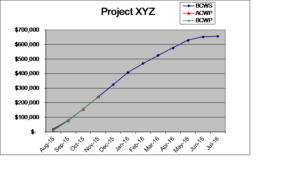
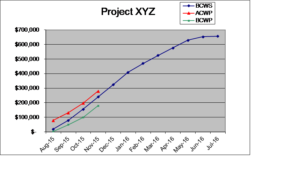
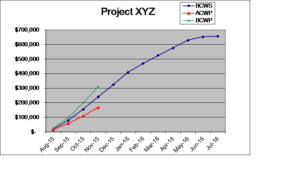
These charts below show examples of earned value management the way I describe in the book in Chapter 8. A way to see project budget, actual spend, and progress toward scheduled activities all in one chart.
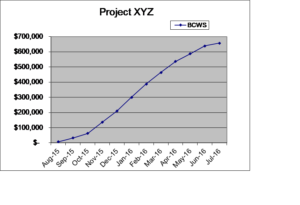
This chart shows the basic budgeted cost of work scheduled curve set at the beginning of a project. What the project spending should look like if everything goes as planned.
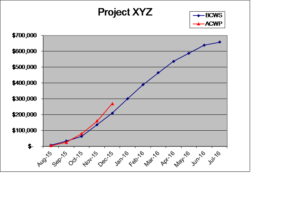
This chart shows now starting to plot the actual spend curve (ACWP) once the project is started. This is a traditional way to look at project financials – actual to budget.
This chart shows now plotting not only budgeted spend and actual spend but also what we should have spent to complete the work that has actually been performed so far (BCWP).
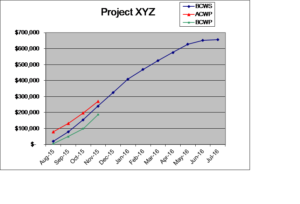
These curves tell you…
The project is on budget and on schedule.
These curves tell you…
The project is over budget and behind schedule.
These curves tell you…
The project is under budget and ahead of schedule.
These curves tell you…
The project is under budget but also behind schedule.
